DataView Columns Screen
In This Topic...
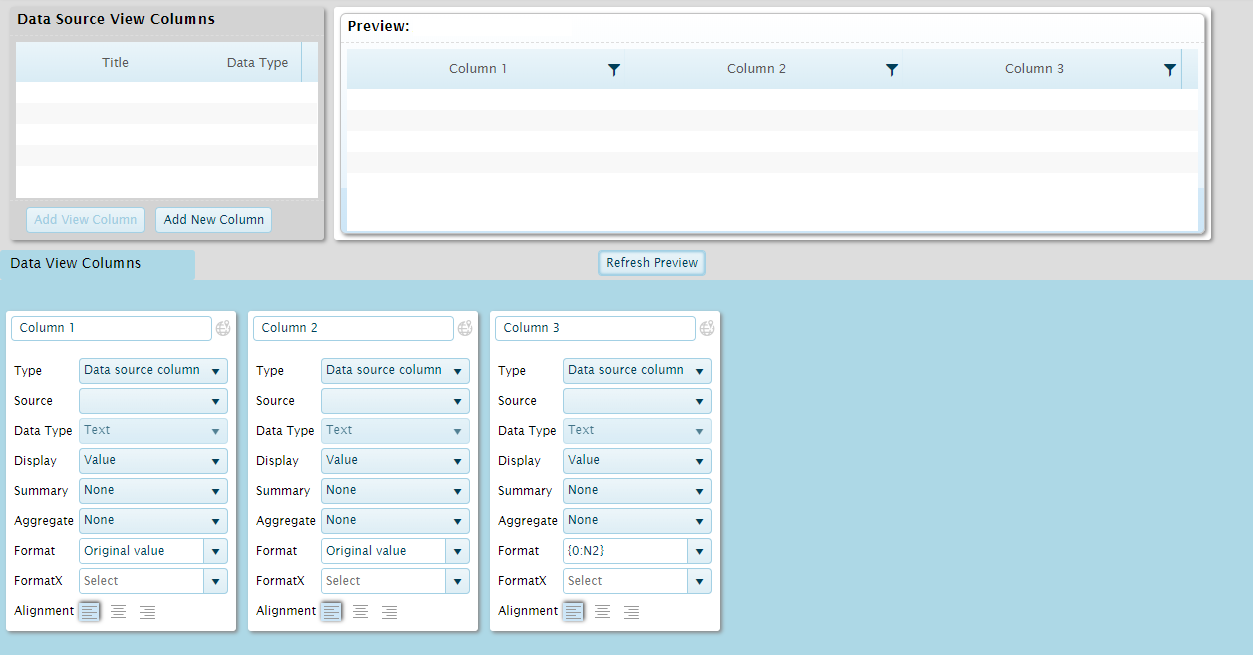
The Cols option switches to the DataView Columns editing screen. This screen is used to select the columns that will be displayed in the dataview and define the settings for each column.

The screen is composed of three sections.
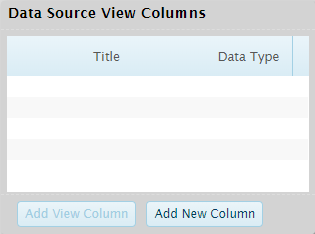
The Data Source View Columns section lists all available columns in the selected data source view or merge view. The Title and Data Type are displayed for each column.
Select a column and click Add View Column to add a column detail entry in the Data View Columns section below. This entry will include the default settings for the appropriate data type.
Click Add New Column to add a blank detail entry in the Data View Columns section below. This entry will have the base settings, and can be configured as needed. These blank entries are generally used to create new columns that are derived from other data, rather than pulling data directly from the data source.
The Preview section shows how the data will appear with the current settings. Click the Refresh Preview button to show the results of any changes.
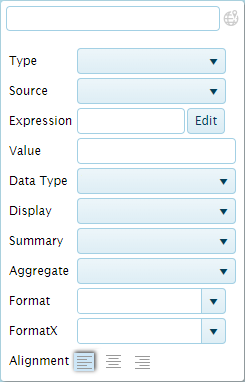
The DataView Columns section displays a column detail panel for each column in the dataview. These are used to define the settings for each column.
| Header | Enter the column header. If no header is provided, a default column number will be displayed. To have a column without a header, use the dashboard configuration to hide the header. |
| The text in this field can be translated |
|
| Type | Select the type of data. |
| This column will display data taken from the associated data source or merge view. | |
| This column will be calculated from data in other columns. | |
| This column will display a single specified value. | |
| Provides ranking values based on data in another column. | |
| Source | This field is available when Data source column is selected as the Type. Select a column from the associated data source or merge view. |
| Expression | This field is available when Calculated column is selected as the Type. This allows a column to display calculated values based on data from other columns in the dataview. See the Using the Expression Editor section for details. |
| Value | This field is available when Constant value is selected as the Type. Enter the text or value to be displayed in each row of the column. |
| Data type | Select the type of data in the column, Text, Integer, Decimal, Date, or Boolean. For Data source column and Ranking value columns, this will be preset to the appropriate data type and cannot be changed. |
| Display | Select how the value will be displayed. |
| Displays the straight value. | |
| Displays a total of the current value plus all preceding values in the column. | |
| Displays a total of each group plus all preceding group values in the column. | |
| Displays the current value as a percentage of the total value for the column. | |
| Displays the total for each group as a percentage of the total value for the column. | |
| Summary | Displays a Total line at the bottom of the table, containing a summary value for the column. Note that summaries are calculated from visible values, so grouped values must have Aggregate settings. Total and subtotal lines themselves are also not included in the summary. |
| Displays the average of all rows. | |
| Displays the average of all rows that contain a value, including zero. | |
| Displays the average of all rows that contain a value, not including zero. | |
| Displays the total number of rows. | |
| Displays the total number of rows that contain a value, including zero. | |
| Displays the total number of rows that contain a value, not including zero. | |
| Displays the highest value in the column. | |
| Displays the lowest value in the column, including zero or no value. Note that if the minimum value is no value, then the total will be blank. | |
| Displays the lowest value in the column, including zero. | |
| Displays the lowest value in the column, not including zero. | |
| Displays the total of all values in the column. | |
| Aggregate | When grouping is used, the Aggregate settings define how grouped values will be displayed. If no aggregate is selected, no value will be displayed for grouped values. |
| Displays the average of all rows in the group. | |
| Displays the average of all rows in the group that contain a value, including zero. | |
| Displays the average of all rows in the group that contain a value, not including zero. | |
| Displays the total number of rows in the group. | |
| Displays the total number of rows in the group that contain a value, including zero. | |
| Displays the total number of rows in the group that contain a value, not including zero. | |
| Displays the highest value in the group. | |
| Displays the lowest value in the group, including zero or no value. Note that if the minimum value is no value, then the aggregate value will be blank. | |
| Displays the lowest value in the group, including zero. | |
| Displays the lowest value in the group, not including zero. | |
| Displays the total of all values in the group. | |
| Format | Select a pre-set format or enter the formatting code to define how the value is displayed in the dashboard. See the Data Formatting Codes section for instructions on formatting codes. |
| Note that the codes provided here will be used as the default formatting when adding the DataView to a Dashboard configuration, but can be overridden in Dashboard design or Analysis modes. Once the format codes have been saved in the Dashboard or Analysis modes, changing the format here will have no effect on those settings. | |
| FormatX | Select a pre-set format or enter the formatting code to define how the value will be displayed when exported to an Excel file. This field accepts standard Excel format codes. |
| Note that the codes provided here will be used as the default formatting when adding the DataView to a Dashboard configuration, but can be overridden in Dashboard design or Analysis modes. Once the format codes have been saved in the Dashboard or Analysis modes, changing the format here will have no effect on those settings. | |
| Alignment | Select if the data should be aligned to the left, centered, or the right. |
When hovering the mouse over a column detail panel, a control bar appears at the top of the panel.
Using the Expression Editor
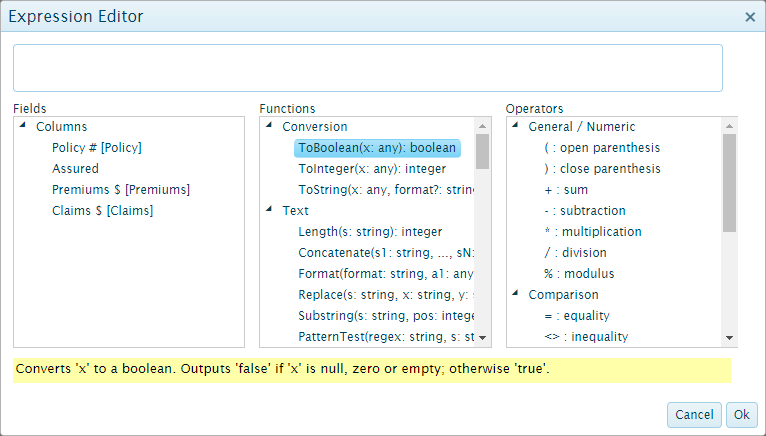
The Expression Editor provides a visual tool to assemble formulas for calculated columns in a dataview.
Click the Edit button in the Expression field. The Expression Editor window opens.
The formula is assembled in the first field. Clicking on options in the three list fields inserts that component into the formula field at the current cursor location.
The following option lists are available. Hover over any option to see a description below the fields.
Click Ok to keep the current formula and close the window, or click Cancel to discard any changes and close the window. The formula is displayed in the Expression field.


 /
/ 


